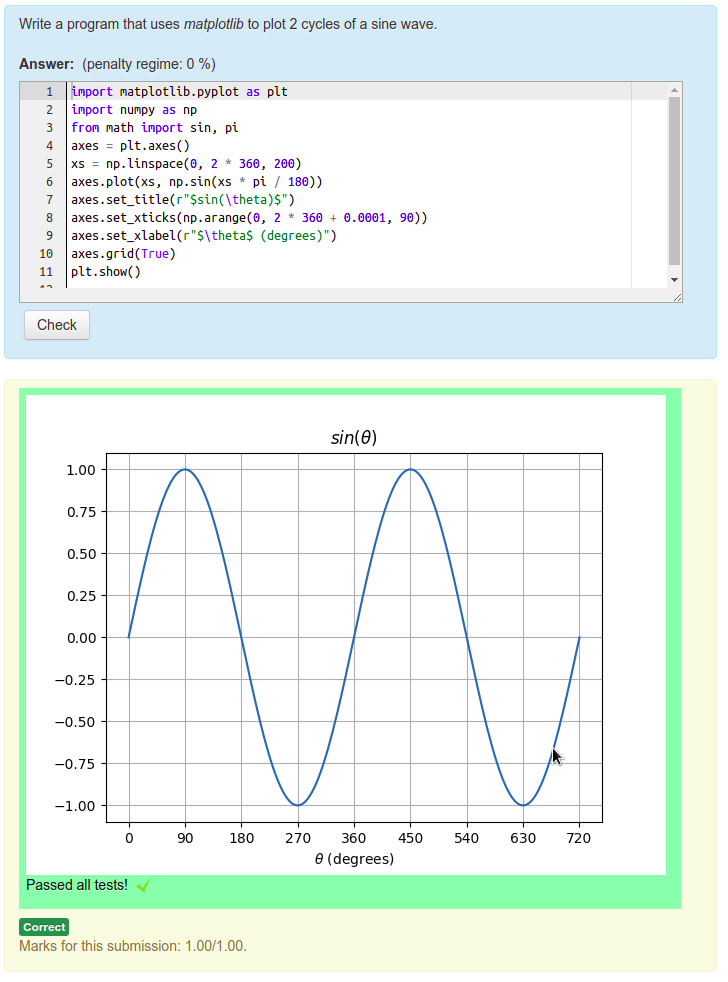
Sometimes we want to ask students to write programs that display images. For example "Write a program that uses matplotlib to display a graph showing two cycles of a sine wave". Or "Write a function that uses the GraphViz "dot" program to plot the Huffman coding tree for a given set of character frequencies". What a shame we can't ask such questions in CodeRunner.
Well, actually, we can! For example:
In this post I'll show how you can author questions that capture and display images generated by student code. The two key ideas are:
- CodeRunner's combinator template graders give you complete control of the feedback, including the ability to include arbitrary html.
- Data URIs allow you to embed the entire contents of an image within the URL (which of course is itself within the HTML).
Combinator Template Graders
If you click the Customise checkbox in the question authoring form, a Customisation section appears as shown in the image below. This lets you edit the template (more on this later) and to set the way in which the question is graded, via a Grading drop down menu. If you select Template grader instead of the default Exact match, as shown in the image below, the role of the template changes. It must now grade the student's submission, rather than just run it.
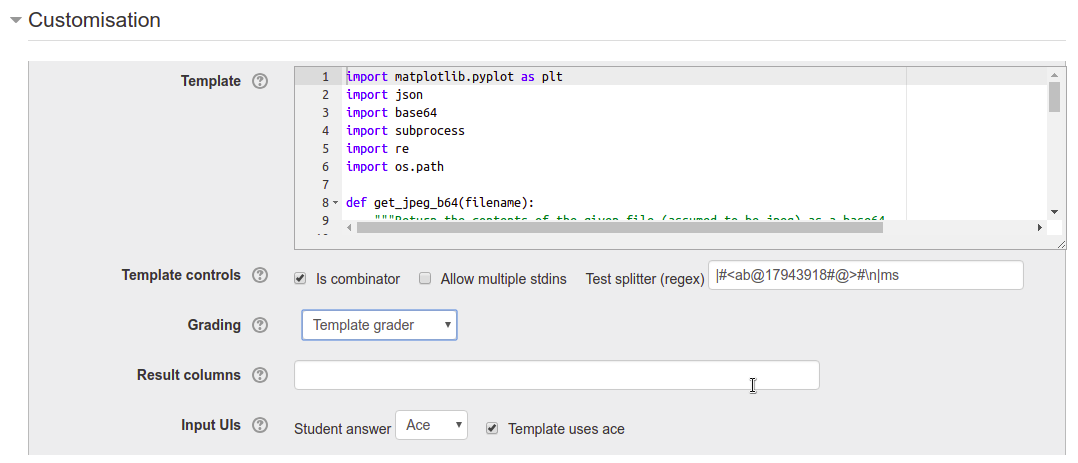
There are two different types of template grader: per-test template graders and combinator template graders. The former, which is what you must write if the Is combinator checkbox is not checked, has to deal with only a single test case. It essentially defines one row of the result table for each run. The latter (combinator template graders), which are what we're concerned with here, are what you must write if Is combinator is checked. Combinator template graders are considerably more powerful but also more difficult to write. They are responsible for grading all test cases and defining the entire result table (if there is to be one) plus two optional additional HTML feedback sections, one before the result table and one after. These are called the prologuehtml and the epiloguehtml respectively. The image(s) we wish to return from the run can be placed in one or other (or both) of those.
The output from a combinator template grader must be a JSON string. The string is documented in the on-line help for the Grading element of the form:
If the template is a combinator, the JSON string output by the template grader should again contain a 'fraction' field, this time for the total mark, and may contain zero or more of 'prologuehtml', 'testresults', 'epiloguehtml', 'columnformats' and 'showdifferences'. The 'prologuehtml' and 'epiloguehtml' fields are html that is displayed respectively before and after the (optional) result table. The 'testresults' field, if given, is a list of lists used to display some sort of result table.
You can read further details in the on-line help itself; for now I wish to focus just on the epiloguehtml which is an html string, normally appearing after the result table. For now we'll assume that the only feedback we wish to give the student is the image itself. We'll further assume that the "grader" will mark any image correct. The output from the template grader then needs to have only the fraction and the epiloguehtml fields. For example, if the latter is simply a cheery message, the output from the template grader could be something of the form
{
    fraction: 1.0,
    epiloguehtml: "<h2>Well done!</h2>"
}
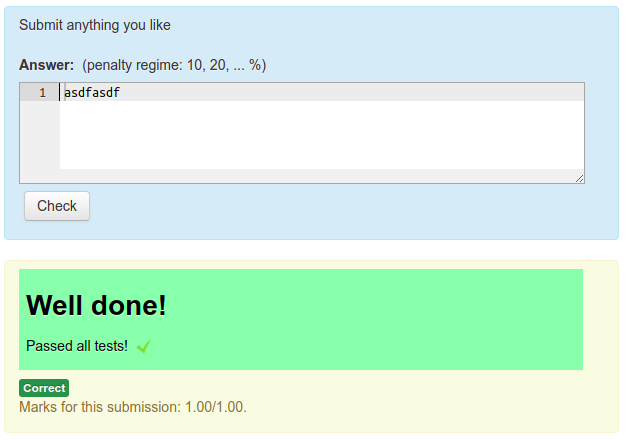
To see such a combinator template grader in action, create a Python3 question, customise it, select a Template grader, leave Is combinator checked and set the template to the code
import json
print(json.dumps({"fraction": 1.0, "epiloguehtml": "<h2>Well done!</h2>"}))
If you test drive this question, submitting any answer at all (it doesn't need to be code), you should see something like the following:
Now we'll look into how to include an image in that feedback.
Data URIs
Data URIs, also known as Data URLs, are URIs where the data that the URI "defines" is encoded within the URI itself rather than being pointed to by a traditional URL. We wish to encode image data into the URI and since the image data is (usually) binary we need to first encode it in base64. If we confine our attention to either png or jpeg images, the format of our data URIs will be either:
- data:image/png;base64,<filedatabase64> or
- data:image/jpeg;base64,<filedatabase64>
where <filedatabase64> is the contents of the file in base64.
Knowing that, a Python function to build a Data URI from a given png or jpeg image file is the following:
import base64
def make_data_uri(filename):
    """Given a png or jpeg image filename (which must end in .png or .jpg/.jpeg
       resp.) return a data URI as a UTF-8 string.
    """
    with open(filename, 'br') as fin:
        contents = fin.read()
    contents_b64 = base64.b64encode(contents).decode('utf8')
    if filename.endswith('.png'):
        return "data:image/png;base64,{}".format(contents_b64)
    elif filename.endswith('.jpeg') or filename.endswith('.jpg'):
        return "data:image/jpeg;base64,{}".format(contents_b64)
    else:
        raise Exception("Unknown file type passed to make_data_uri")
Running the student code safely
The biggest complication with template graders in general, and particularly with combinator template graders, is that they must output the specified JSON record defining the feedback. They must do this even if the student code is faulty, or throws an exception or segment faults or times out, etc. This means the code has to be run separately from the template itself in some sort of secondary sandbox with a watchdog timer.
In Python, the subprocess module is usually the best tool for the job, with a piece of code like the following:
import subprocess
output = ''
failed = False
try:
    outcome = subprocess.run(
        ['python3', '-c', student_code],
        stdout=subprocess.PIPE,
        stderr=subprocess.PIPE,
        timeout = 2, # 2 second timeout MUST BE LESS THAN JOBE TIMEOUT
        universal_newlines=True,
        check=True
    )
except subprocess.CalledProcessError as e:
    outcome = e
    output = "Task failed with return code = {}\n".format(outcome.returncode)
    failed = True
except subprocess.TimeoutExpired as e:
    outcome = e
    output = "Task timed out\n"
    failed = True
output += outcome.stdout
if outcome.stderr:
    output += "*** Error output ***\n"
Note that the watchdog timer (in this case the timeout parameter to subprocess.run) must be less than the Jobe timeout for the task, which for Python defaults to 3 seconds. Otherwise an endless loop in the student code will result in the entire run being aborted by Jobe and the required JSON grader output won't happen.
Generating the JSON output
Suppose we are expecting the student code to generate an image file called outputimage.png. Then, having run the student code in a subprocess as above, the template grader can finish by picking up that image, encoding it into a data URI, and inserting that data URI into the epiloguehtml field of the final JSON output. For example:
html = ''
if output:
    html += "<pre>{}</pre>".format(output)
if not failed and os.path.isfile('outputimage.png'):
    data_uri = make_data_uri('outputimage.png')
    html += """<img class="data-uri-example" title="Output image" src="{}" alt="outputimage.png">
    """.format(data_uri)
# Lastly print the JSON-encoded result required of a combinator grader
print(json.dumps({'epiloguehtml': html,
                  'fraction': 0.0 if failed else 1.0
}))
Note that any textual output from the program precedes the image in the displayed feedback.
Picking up matplotlib images
The example at the start of this post shows a Python matplotlib question. Normally the student code for such a question will not explicitly generate a file; rather, the image will be displayed on screen when the code is run. To capture the matplotlib output into an image file when running on Jobe, we must prefix the student code with a request to matplotlib to use a non-interactive backend such as Agg, which writes figures to a png file. We also have to add suffix code to call plt.savefig.
The attached file matplotlibimagedemo.xml is an export of the question shown at the start of this posting. Also attached in the file matplotlibimagecapturetemplate.py is the template code for that question.
Grading the output
The astute reader will have noticed that while this question produces nice-looking output, the student gets given full marks for any code at all that runs correctly, regardless of whether it produces an appropriate output image or not. So ... it's useless, right?
Well, maybe not totally useless. That particular question does let students experiment with matplotlib code and see the output images in, say, a tutorial context. But it's certainly useless from an assessment point of view.
However, all is not lost. If what you're trying to grade is the matplotlib image properties, you can pick up the current axes (after the student code is run) and check various attributes such the title, axis labels, data plotted, etc against the expected ones and issue part marks accordingly.
But ... this blog has gone on long enough, so I'll finish with an example Python function that prints out the properties of the current matplotlib axes object (assumed to be a bar chart). You can use that as a starting point for your own questions.
def print_plot_info():
    """Output key attributes of current plot, as defined by plt.gca()"""
    try:
        current_axes = plt.gca()
        subplot = current_axes.axes   # The actual plot, assuming just one subplot
        print("Plot title: '{}'".format(current_axes.title.get_text()))
        print("X-axis label: '{}'".format(subplot.get_xlabel()))
        print("Y-axis label: '{}'".format(subplot.get_ylabel()))
        print("Number of bars:", len(subplot.patches))
        x_tick_labels = [label.get_text() for label in subplot.get_xticklabels()]
        if all(label.strip() == '' for label in x_tick_labels):
            x_tick_labels = [str(pos) for pos in subplot.get_xticks()]
        print("\nX-axis ticks:\n" + ', '.join(x_tick_labels))
        y_tick_labels = [label.get_text() for label in subplot.get_yticklabels()]
        if all(label.strip() == '' for label in y_tick_labels):
            y_tick_labels = [str(pos) for pos in subplot.get_yticks()]
        print("\nY-axis ticks:\n" + ', '.join(y_tick_labels))
        bar_height_strings = [format(bar.get_bbox().ymax, '.0f') for bar in subplot.patches]
        print("\nBar heights:\n" + ', '.join(bar_height_strings))
    except Exception as exception:
        print("Failed to get plot info:", str(exception))
Happy authoring!
-- Richard