Vector Diagram UI for Electrical Engineering

Vector Diagram UI for Electrical Engineering

by Ravil Goetzke -
Number of replies: 2

Dear developers,

first of all, I want to thank you for the work you have done.

We would like to use coderunner to provide the students with a UI for drawing a vector diagram which is queried in a test. Similar to the graph UI, the students should draw arrows in a canvas.
I have already written an HTML + JS program for this, where you can do exactly that. 

(https://jsfiddle.net/RavilG/t4fj9gw0/)

This interface works wonderfully on the course page. However, I don't quite understand how I can get this in to Coderunner so that I can evaluate the vector diagram later.

The program continuously fills the "arrows" array. I would then evaluate this with a Python code and assign the points like:

is90Dergree (U_C, I_C)

-> true: 0.5P

-> false: 0P

I'm still new to JS and have done this through self-appropriation. 

Can you give me ideas how I can implement this?


In reply to Ravil Goetzke

Re: Vector Diagram UI for Electrical Engineering

by Richard Lobb -

What a fun exercise!

What I did very quickly was:

  1. Create a new question of type python3
  2. Customize
  3. Select HTML UI as the User Interface
  4. Pasted your HTML and JavaScript (the latter wrapped in a <script> tag) into the Global Extra field.
  5. Added to the HTML the following text area element
    <textarea class="coderunner-ui-element" name="crui_arrows" id="crui_textarea_arrows"></textarea>
  6. Added to the list of global JavaScript vars:
    arrow_textarea = document.getElementById("crui_textarea_arrows")
  7. Added to the JavaScript drawAll function the following line at the end:
    arrow_textarea.value = JSON.stringify(arrows);
  8. Changed the template to print (with a bit of formatting and tweaking) the value of {{ STUDENT_ANSWER}}
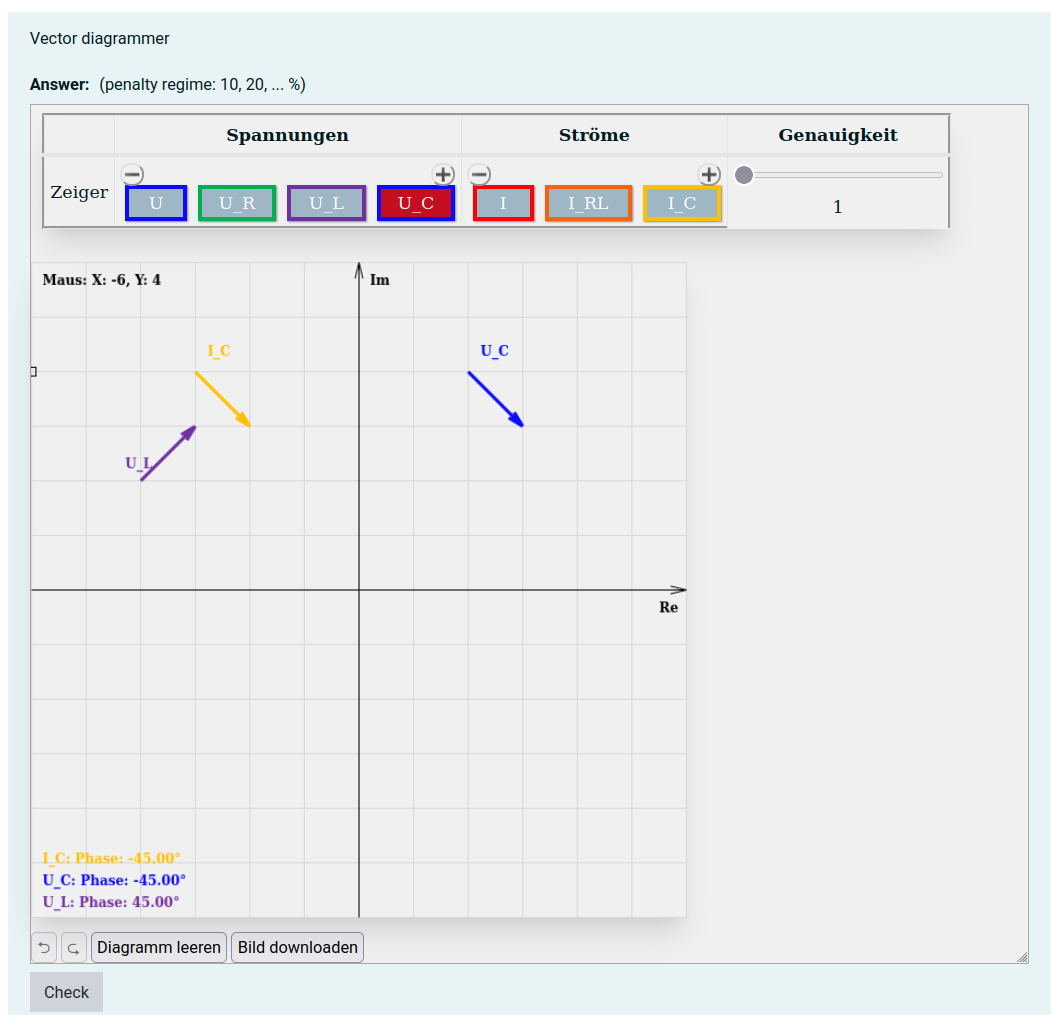
The result is a CodeRunner question that lets you draw arrows, click Check, and send the current serialised values of the arrows array to CodeRunner.

For example (and I've no idea what this question is all about since I don't speak German, nor understand what you're trying to do), before clicking Check:

Before clicking check

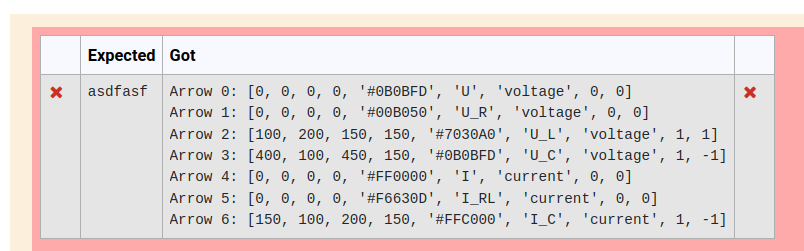
which then displays the following result table when you click Check:
Result table

But this is just a very first step. The contents of the arrows array is lost when you click Check or review the question etc. I don't have time to explore fixes, but two approaches come to mind:

  1. Change the code so that the arrows array isn't used at all. Instead the state of the current set of arrows is maintained always in a serialised form in the crui_arrows textarea element. That way the set of arrows gets automatically sent to Moodle on Check and gets restored automatically. This is the "correct" solution in the sense that it fits the standard expected behaviour of an HTML-UI question: a set of HTML elements whose state is sent to Moodle on check and restored on reload.
  2. Find a way of reloading the arrows array from the textarea when the question gets reloaded. One hacky solution is to add an <img> element to the HTML with an invalid src attribute. Then add an onerror event handler that will thus run whenever the question is reloaded. I tried quickly to make this work but I think your code subsequently overwrote the contents of the arrows array, and it all got too complicated.
I'd be a lot more confident with the first method, but it probably takes quite a bit more code.

You'll probably want to read up on the HTML_UI in the documentation.

I attach my first quick hack question, which generated the above images. I wish I had more time to play with this, because it looks like great fun. But I'm heading off for a week's holiday tomorrow.
In reply to Richard Lobb

Re: Vector Diagram UI for Electrical Engineering

by Ravil Goetzke -
Thank you so much, you are great!

Your solution was pretty simple. I adapted my code as you said and was finally able to finish the test. I also cheated a bit: If you see feedback (if (document.querySelectorAll ("div.specificfeedback"). Length> 0), you can no longer draw.

Now I just have to comment out everything and throw out superfluous functions.

Little guide:
In the question text (HTML view) I specify the voltages (ger=Spannungen) and currents (ger=Ströme) buttons that the student should draw. The script then fetches it in the table. So you can easily manage the buttons with copy-paste for the respective exercise.

If you set the (id = testmode) .Checked to "False" or delete it,

 you can also add and delete your own vectors and draw true-to-scale vectors. I want to do something like that later as a test mode. Everything has already been implemented for this, only the py function would have to be given a tolerance if the accuracy (ger=Genauigkeit) is increased.
You can see it with (HTML view)
(id = testmode) .Checked "= True" and
(id = testmode-Scales-check) .checked "= True"
(id=Genauigkeit).innerHTML=10


I'm really happy that it worked out this semester, thank you very much again!