New question type in octave script style

New question type in octave script style

by Alexander D -
Number of replies: 3

Dear CodeRunner community,

is it possible to realize a question type like follows:

We have a simple octave script like this

h=0.1; % step's size
N=10; % number of steps
y(1)=1;
for n=1:N
y(n+1)= y(n)+h*(-6*y(n));
x(n+1)=n*h;
end
plot(x,y)

(just for example: Euler's method, taken from here).

Now, I want that the students should see the above code like this

h=0.1; % step's size
N=10; % number of steps
y(1)=1;

Now, they should add the for-loop as above and by clicking the "check" button they should see the
corresponding plot.

Shortly, I want the students to add some parts of specific octave scripts and by clicking the "check" button the whole script should run.

I assume that is possible by adding a new octave question type for each script. But not really sure about this.

Best,
Alex


In reply to Alexander D

Re: New question type in octave script style

by Richard Lobb -

If you want students to see a graph when they click check you need to use a combinator template grader and you need to construct a data_uri containing the plot. This is guru territory - are you sure you want to go there?

And an even bigger question: how do you want to grade the result? It's certainly possible to implement the grading in the template but it can be quite hard to come up with grading criteria and then to implement them (by inspecting the attributes of the current plot).

Also, to generate graphs on the Jobe server with Octave you will need to have gnuplot installed. It's not part of the basic Jobe, so an administrator will have to run the command

apt install gnuplot

The code that you run needs to select gnuplot as the graphics toolkit and set figure visibility to 'off'.

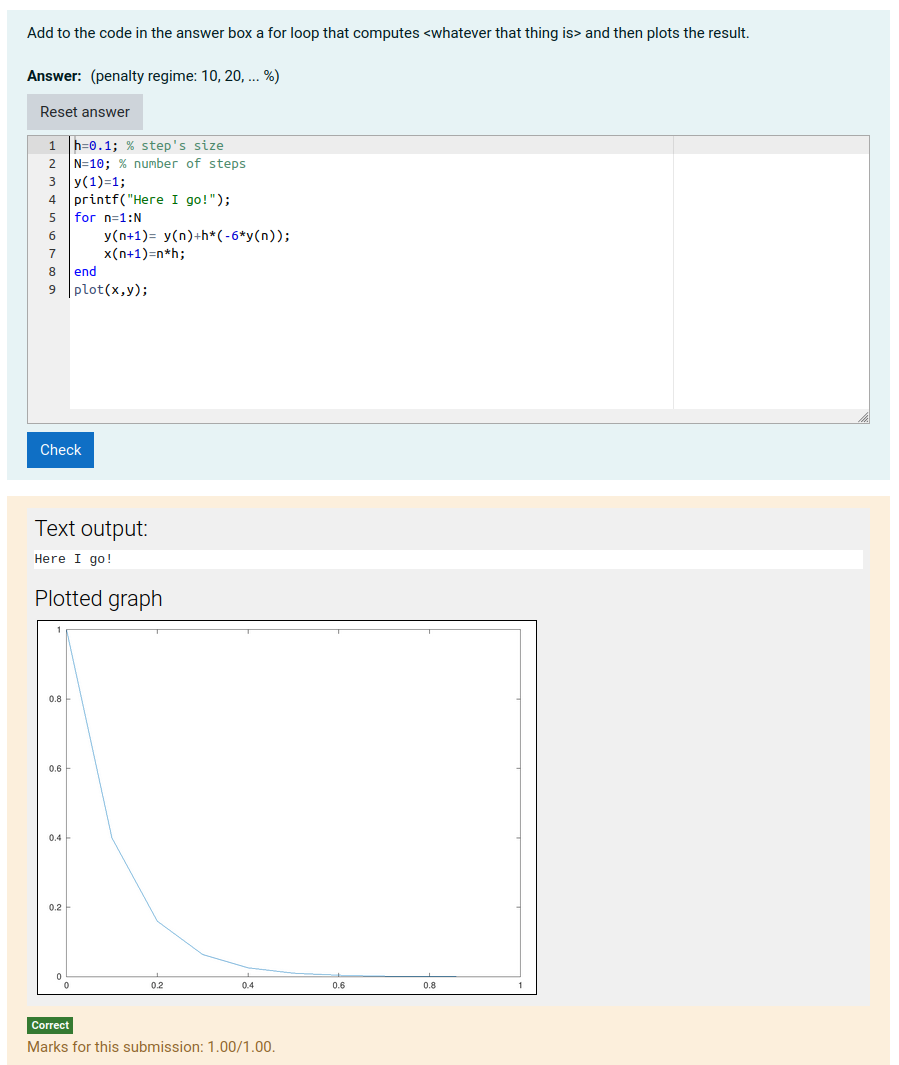
If you still wish to proceed, I attach an XML export of a question that does roughly what you ask. I use the answer-box preload to display the first few lines to the student, who then has to add the for loop plus the call to plot. If you don't want the student to do the plotting you can move that bit into the template. The question simply displays any text output generated by the run followed by the plotted graph. A run of the question looks like this:

Octave graph output example

Note that any runtime error messages displayed to the student will appear to have the wrong line numbers due to the extra code inserted before their program. This can be solved by postprocessing the output but I think things are complicated enough already :)

In reply to Richard Lobb

Re: New question type in octave script style

by Alexander D -
Dear Richard,
thank you very much for your quick reply.
I thought about it again and want to ease the problem a bit:
Maybe it is enough to compare the students calculations of the approximated values
x(1), x(2),... x(n),.... and y(2), y(3),...
with corresponding precalculated values. Instead of running a gnuplot, one could easily show a picture afterwards.
I think this is possible by using your example of the last post.
So, the last open issue would be to create some sort of 'loop', which calculates the approximated x- and y-values of the 'solution'.

Best,
Alex
In reply to Alexander D

Re: New question type in octave script style

by Richard Lobb -

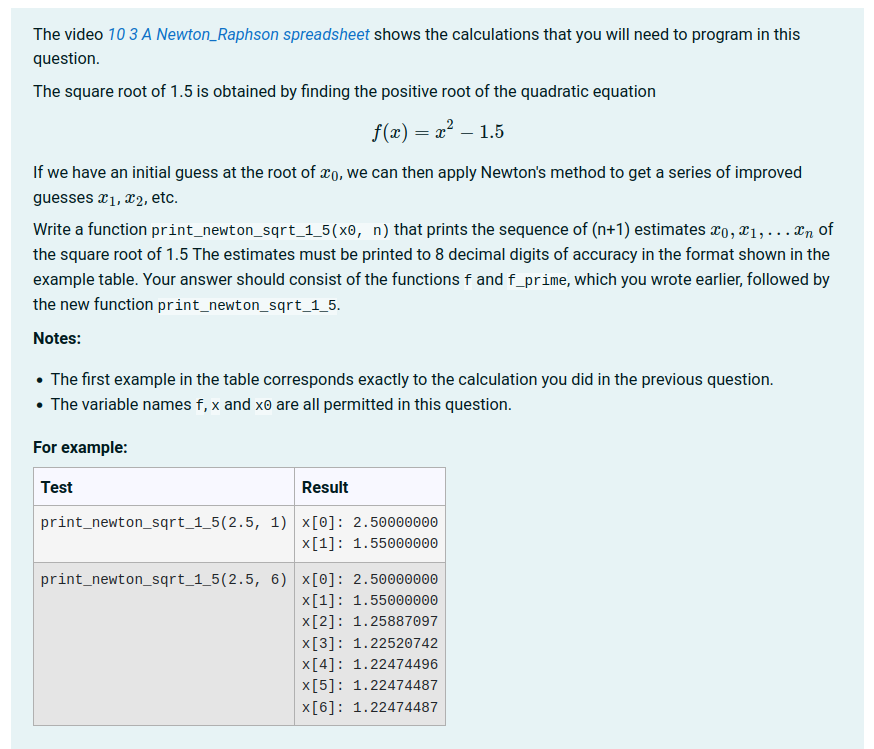
Yes, I think asking students to print the values they compute is much easier than trying to display a graph and then grade it. Here, for example, is a question from our introductory programming course for engineers:
Screen dump of Newton iteration question

However, you do need to be very careful to deal with numerical rounding errors with questions of this sort. The grader we use in questions of this sort parses both the expected output and the student output for floating point numbers, and then compares these to within an acceptable tolerance. This is again advanced question authoring. A much simpler approach is to get the student to write a function that returns an array of expected values, then the test case you write can loop through the values, comparing with the expected one to within a given tolerance.

You can compute the expected results in a bit of code in the Extra field of the testcase and use a template that runs the code in the Extra field immediately before the code in the Test field. For example, the template might be the following (the same as the Octave function template with on extra line):

{{ STUDENT_ANSWER }}

format free

{% for TEST in TESTCASES %}
{{ TEST.extra }}; % This is the new line I added
{{ TEST.testcode }};
{% if not loop.last %}
disp('##');
    {% endif %}
    {% endfor %}
@17943918#@>

Then you have might an Extra field in a test like

for i = 1:10
    expected(i) = ... ; % Whatever
endfor

And a test like

got = student_func(param1, param2, ...);
% Now we check your answer against our hidden expected one
for i = 1:10
    if (abs(got(i) - expected(i)) > 1.e-5)
        printf("Wrong answer for got(%d): expected %.5f, got %.5f\n", i, got(i), expected(i)")
    endif
endfor

There are probably lots of errors in there - my octave is rusty. But hopefully the general idea is clear.